


Introduction
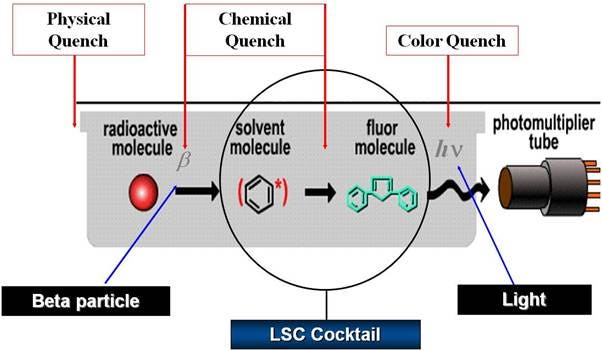
Quenching occurs when the energy emitted by the radioisotope is not caught entirely by the photomultiplier tube of the counting instrument. The signal reduction can occur at various stages of the energy transmission process:
Quenching
For example:
- Physical Quench occurs when the radioisotope is physically separated from the solution in which the scintillator is dissolved. Another example is when a barrier is present, such as activity on solid supports. Properly homogenizing the solution will avoid physical quench.
- Chemical Quench occurs when the energy of the beta particle is absorbed by compounds that will not (or with too low efficiency) re-emit the energy during the transfer to the solvent molecules. The energy of the beta particle will not reach the scintillator and consequently, no light will reach the detector.
- Color Quench occurs when the emitted light is absorbed by color in the sample. The energy transmission can occur correctly, but once the light is emitted by the scintillator it is absorbed by color in the sample. Consequently, the signal detected at the photomultiplier tube will not represent the total quantity of light truly emitted.
Counting Efficiency
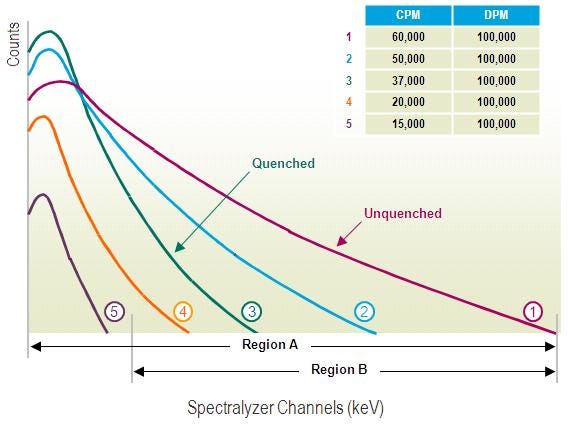
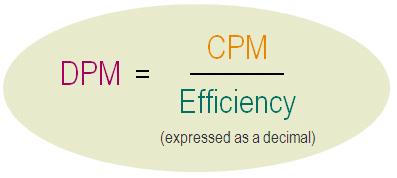
To determine the absolute activity of a sample, expressed in DPM (disintegrations per minute), it is necessary to measure the level of quench of the samples first. Various methods can be used to determine the counting efficiency of the measure. The counting efficiency expresses the level of quench in a sample and is the ratio between the number of events counted by the instrument (expressed in CPM: counts per minute or CPS: counts per second) and the real quantity of disintegration events.
An increase in quench will reduce the counting efficiency: fewer photons will hit the detector, and the quantity of counts will be lower for a quantity of radioactive events.
Counting efficiency
Quench effects can be minimized by optimizing sample preparation and choosing the correct instrument settings (i.e., choosing the correct energy windows and optimizing the counting windows).
Quench Correction Methods
Internal Standards
Manual method using the addition of a quantity of known DPMs (disintegrations per minute) from an internal standard to an unknown sample to determine the counting efficiency.
- The activity of the sample is measured --> CPM(s)
- The activity of the internal standard is known --> DPM(st) and is equivalent to: CPM(st) / Counting Efficiency (1)
- Then the internal standard is added to the sample, and the activity is measured again --> CPM(s+st)
We know that CPM (s+st) =CPM (s) + CPM (st) (2)
When we put (1) and (2) together, it gives:
CPM(s+st) = CPM(s) + [DPM(st) x Counting Efficiency]
From there, we obtain the counting efficiency and the DPM(s) :
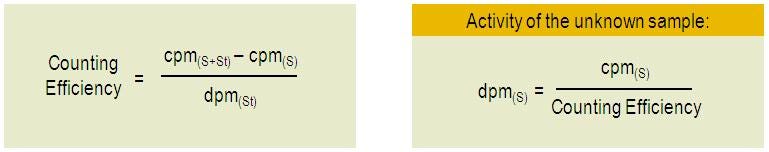
CPM to DPM
You can also choose to divide your sample into two vials, add the internal standard to one of the two vials, and add a non-radioactive solution with a volume equivalent to the internal standard solution to the other vial. This method has increased accuracy, but is labor intensive.
Use of Quench Curves
A standard quench curve is a series of standards in which the absolute radioactivity (DPM) per vial is constant and the amount of quench increases from vial to vial. When a quench curve is made, the DPM value in each standard is known. Each standard is counted, and the CPM is measured. The counting efficiency is calculated using the following relationship:
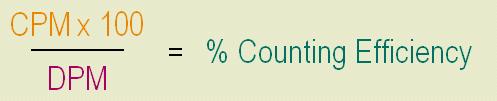
Percent counting efficiency
At the same time, the quench indicating parameter (QIP) is measured for each standard. A correlation is made using the QIP on one axis (X) and the % efficiency on the other axis (Y). A curve is fitted to the standard points. Examples of quench curves are shown below, for tritium and 14C:
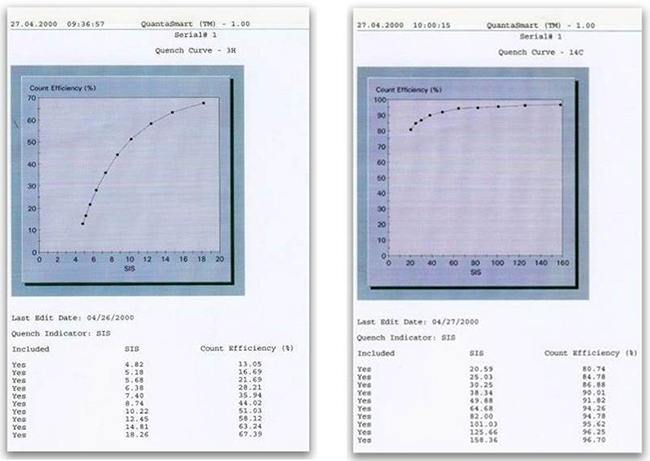
Quench curves
When unknowns are counted, CPM and the QIP of the sample are measured. Using the QIP, the counting efficiency is determined from the quench curve, and the sample DPM are calculated by applying the appropriate efficiency to the CPM of the sample.
CPM and QIP
Quench curves use the relationship between counting efficiency and the QIP to translate the measured CPM to DPM. The two most important methodologies to determine the QIP use either the sample spectrum or the spectrum of the external standard.
The QIP can be derived from the sample spectrum or from the external standard spectrum:
SIS (Spectral Index of the Sample)
This quench parameter is derived from the sample spectral endpoint. The beta-spectrum represents a probability distribution of beta-particles with a defined energy. From this distribution we can calculate the average kinetic energy of all beta-particles. With increasing quench, the average kinetic energy of all beta-particles decreases and the beta-spectrum presents a shift to the left:
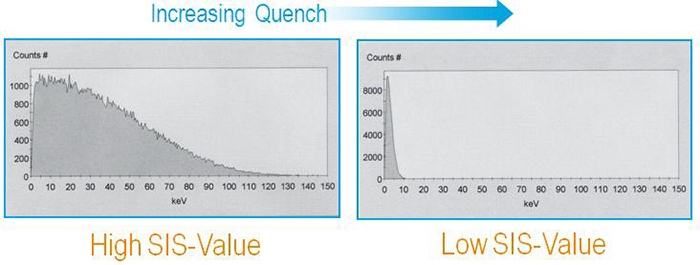
SIS
This method is not adapted for dual counting and requires good counting statistics. It is therefore not recommended for low activity samples.
tSIE (Special Index of the Transformed External standard spectrum)
The tSIE (also called SQP(E) on Wallac counters) is derived from the external standard spectrum. Vial counters include a built-in gamma-source of 133Ba or 152Eu, external to the sample. The gamma radiation of the external source provokes the ejection of an orbital electron from atoms in its environment. The ejected electron, called a Compton electron, is very similar to beta particles, and will induce the same scintillation effects.
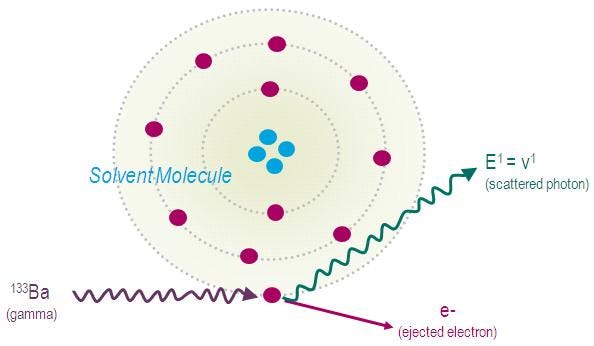
tSIE
From there, the software of the instrument uses the RST (Reverse Spectral Transform) technique to obtain the transformed spectrum of the external source:
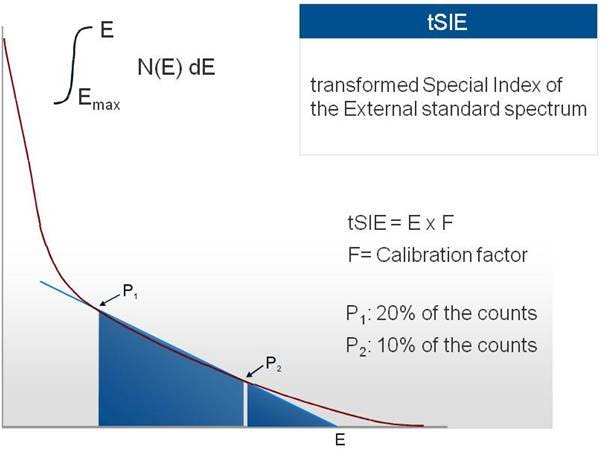
tSIE transform
Two points are theoretically chosen by the software, the first at 20% of the counts and the second at 10% of the counts. Between these points a line is drawn, whose intersection with the X-axis defines the tSIE value. This process is also done when the SNC run is performed on the instrument (ideally on a regular basis), and it resets the tSIE value of an unquenched sample to 1000.
With increasing quench, the Compton-electron spectrum will be modified; consequently, the tSIE value decreases.
Quench curves for 3H and 14C are usually pre-installed in the library of the instrument. However, users can decide to build new quench curves, either preparing their own quenched sets, or using commercial sets. These sets should be chosen based on the choice of the cocktail used for counting:
- Toluene-based quenched sets should be used to establish quench curves which will be referred to when counting samples are mixed with classical scintillation cocktails
- Ultima Gold™-based quenched sets should be used to establish quench curves which will be referred to when counting samples are mixed with safer scintillation cocktails
- Quench sets usually contain 10 vials of known activity with increasing quantity of a quenching agent. When counted, a curve is produced showing the relation between tSIE and counting efficiency (see picture below):
External standard
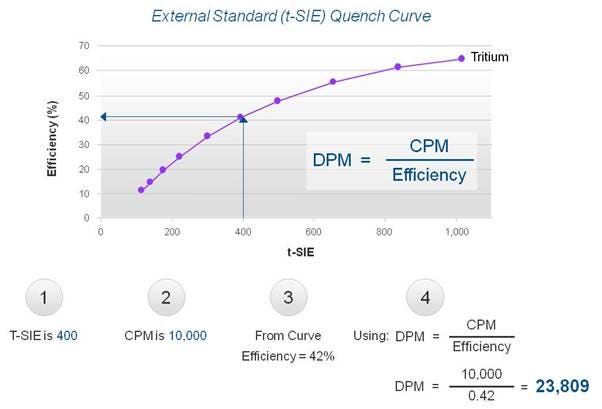
When an unknown sample is counted, the tSIE value is determined (1). At the same time, the CPM of the unknown sample is measured (2). The software looks at the quench curve stored in the software and determines the corresponding counting efficiency (3). Knowing the CPM of the unknown sample and the counting efficiency allows you to calculate the DPM value, or the absolute activity, of the sample (4).
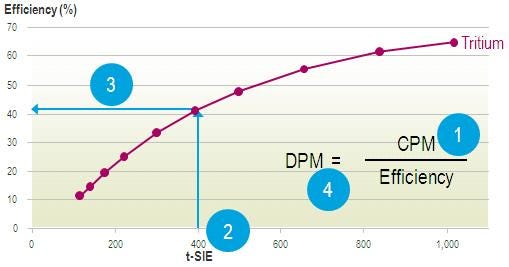
tSIE efficiency
Direct DPM
Direct DPM uses a proprietary technique to determine the counting efficiency and DPM for each sample. This automatic feature even permits the counting and DPM calculation of different nuclides within the same cassette without changing the program if half-life correction is not used. The Direct DPM program is installed at the factory; all the operator needs to specify is the counting time (and the nuclide if half-life correction is to be applied).
Any number of samples can be counted with Direct DPM in one or more cassettes. Direct DPM is best used for sample activity more than 1000 CPM. The direct DPM method is extremely simple to use, does not require windows settings, corrects for chemical and color quench, and is very useful for short half-life nuclides when quench standards are not commercially available.
Note that Direct DPM cannot be used for dual-labeled samples, or for overlaid spectra (decay with secondary events, as with 125I, occurring with non-pure beta-/gamma-nuclides). Direct DPM is based on the sample counts and needs good counting statistics for accurate results, samples should produce more than 1000 CPM. Therefore, this method cannot be used for low level applications.
Direct DPM
For research use only, not for use in diagnostic procedures. The information provided above is solely for informational and research purposes only. Revvity assumes no liability or responsibility for any injuries, losses, or damages resulting from the use or misuse of the provided information, and Revvity assumes no liability for any outcomes resulting from the use or misuse of any recommendations. The information is provided on an "as is" basis without warranties of any kind. Users are responsible for determining the suitability of any recommendations for the user’s particular research. Any recommendations provided by Revvity should not be considered a substitute for a user’s own professional judgment.