


Overview
The Kd of a protein-protein interaction may be determined with Alpha assays using one of two approaches: saturation curves or competition assays. Of these, competition assays are applicable to a wider range of assay conditions.
Saturation curves for determination of Kd
In limited situations, saturation curve assays can be performed to determine the affinity constant (Kd) for the protein-protein interaction in Alpha format. In a saturation assay, one binding protein is titrated across a range of concentrations to generate a saturation curve. The Kd can be derived from the data as the protein concentration at which half maximal signal is reached. Saturation curves can be used to determine Kd only if the assay meets the following criteria:
- The Kd for the protein-protein interaction is far enough below the binding capacity of each bead so that all protein concentrations used to derive the Kd (usually up to 5X Kd) fall below the bead binding capacities. (This typically means that the Kd needs to be in the sub-nanomolar range, though some beads have a binding capacity up to ~300 nM – refer to Table below.)
- There is an excess of the binding partner that will be varied in comparison to the concentration of the fixed binding partner. For example, if you are varying the concentration of Protein Y in the saturation curve, Protein Y should be in at least 10X excess (molar concentration) compared to Protein X. Otherwise, there is a ligand-depletion (protein-depletion), meaning that the percentage of “bound” protein can be above 10%. In this case, the amount of free ligand (protein) cannot be estimated as being equal to total ligand (protein) for the curve fitting equation.
If the expected Kd is not below the binding capacity of the beads used in the assay, a competition binding assay must be used to determine the Kd for the protein-protein interaction. The reason for this is that the bead system will become saturated when the binding capacity is reached, and two competing equilibria will be occurring: excess protein will be dissociating the interaction between the two beads, decreasing signal (the hooking effect), while the excess protein may simultaneously be driving the interaction between the two proteins, increasing signal. The curve generated will be a composite of these two equilibria, once the binding capacity has been reached. This composite curve may appear to reach saturation, may appear to begin to hook (decrease) slightly, or may continue increasing without reaching saturation (depending on the actual Kd, the concentrations of proteins being tested, and the binding capacities of the beads used in the assay).
Symptoms that a saturation curve cannot be used to accurately predict the Kd:
- Underestimated Kd in Alpha assay. If the Alpha data is giving a Kd that is below what is expected for the protein-protein interaction, it is possible that bead saturation is skewing the data. A competition binding curve should be tested for Kd determination.
- Kd is calculated to be ~5 nM when using streptavidin beads. Because the streptavidin-biotin interaction is a relatively tight interaction, the binding capacity of these beads is fairly predictable. If the calculated Kd is between 5 and 10 nM and streptavidin beads are being used, it is likely the binding capacity of the beads has been exceeded. A competition binding curve should be tested for determination of Kd.
Example data:
An excellent example of the use of saturation curves to determine Kd in an Alpha assay format is in a paper by Cassel et al. (2010). In this work, the Kd of the interaction between TAR DNA binding protein 43 (TDP-43) and biotinylated single-stranded TAR DNA and 6 TG repeats was determined to be 0.75 nM and 0.63 nM, respectively. Association and dissociation rates were also calculated and used to derive Kd values. In both cases, the Kd derived was consistent with previous reports using other methods.
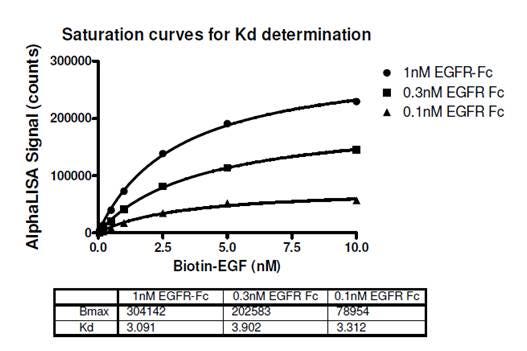
In the example below, saturation curves were used to determine the Kd for the interaction between biotin-murine EGF and Fc-fusion human EGFR (Figure 1). Streptavidin Donor beads and Protein A AlphaLISA Acceptor beads were used in the assay. The expected Kd is ~2.8 nM as determined by a radioligand binding assay (Lax, I. et al., 1988). In the protocol for the data below, a 3-step assay was performed as follows. 1) biotinylated EGF and EGFR-Fc addition, 60 minute incubation. 2) Protein A AlphaLISA Acceptor bead addition, 60 minute incubation. 3) Streptavidin Donor bead addition, 30 minute incubation followed by reading the plate. The streptavidin Donor beads were added last (after the second incubation) to prevent the multi-biotinylated EGF from bridging two streptavidin Donor beads before other interactions could occur.
Figure 1. Saturation curve is used to determine Kd of the interaction between biotinylated EGF and EGFR-Fc in Alpha format. View full protocol here. The expected Kd for this interaction is ~2.8 nM. This approach is generally suitable for low (sub-nanomolar) Kd values.
Example data where Kd cannot be determined by a saturation curve: In the data below, the expected Kd of the interaction between HDM2 and p53 peptide is ~ 0.3 μM. This is well above the expected binding capacity of the beads used in the Alpha assay, which is an indication that the saturation method should not be used to determine Kd; instead, a competition binding assay should be used. Based on the data below, the Kd would be incorrectly derived to be ~ 2 nM. (10 nM biotinylated-p53 peptide was used in the assay.)
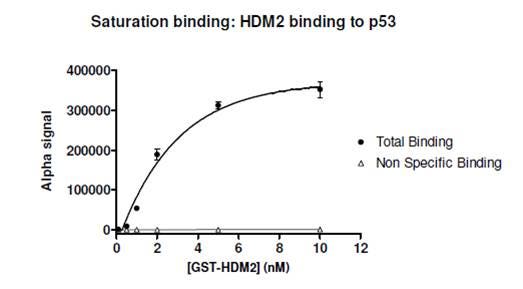
Figure 2. Saturation curve for interaction between GST-HDM2 and biotinylated p53. The expected Kd for this interaction is ~ 0.3 μM (reference). Because the expected Kd is above the estimated binding capacity of the anti-GST-coated Acceptor beads and the streptavidin-coated Donor beads, a saturation curve should not be used to determine Kd.
When performing a saturation curve to derive Kd, it is important to choose protein concentrations above, below, and centered around the expected Kd. If possible, at least eight protein concentrations should be chosen, ranging from 10X Kd to 0.1X Kd. The concentration of only one binding partner (protein) should be varied – the other protein should be held at a constant concentration that is below the binding capacity of its associating bead and at least 10X below the highest concentration of the varied protein.
Competition binding assays for determination of Kd
In many cases, a competition binding assay will need to be used to determine the Kd in Alpha format. This is because many protein-protein interactions have dissociation constants that are above the binding capacity of the beads. In the competitive binding assay, increasing concentrations of the untagged version of Protein X or Protein Y are used to displace the tagged reagent from the assay, disrupting the association between the beads (competition). The Kd value can then be calculated from the IC50 value based on a method introduced by Cheng and Prusoff:
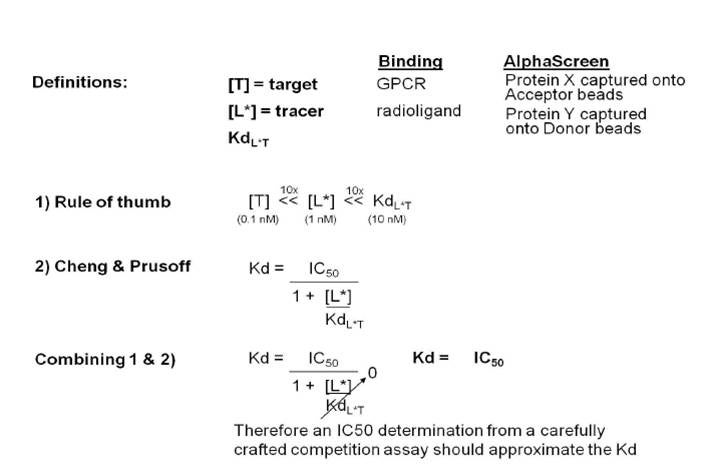
Cheng-Prusoff equation
The information above is written from the point-of-view of a receptor-radioligand binding assay. In an Alpha protein-protein interaction assay, the “target” becomes one of the tagged proteins being caught to the bead, and the “tracer” becomes the second tagged protein binding to the other bead. If the Kd is significantly higher than the concentration of either protein, the value for [L]/Kd in the Cheng & Prusoff equation approaches zero. The full equation then becomes Kd = IC50/(1+0), and the Kd approximates the IC50 in the competition binding assay.
In order to derive a Kd in this type of assay, a few criteria need to be met:
- The Kd needs to be at least 10X higher than the concentration of either tagged protein used in the optimized assay. These protein concentrations should be chosen from the first cross-titration experiment, keeping in mind that it is not necessary to pick the concentrations that give the highest signal-to-background. As long as the assay window is acceptable, lower concentrations may be chosen.
- The concentrations of each tagged protein used in the assay need to be below the binding capacity of their respective bead (refer to Table below for guidance).
- The concentration of one labeled protein (“target”) should be at least 10X below the concentration of the other labeled protein (“tracer”). If you are using tagged Protein Y, untagged Protein Y, and tagged Protein X in the competition assay, tagged Protein X is the target and tagged Protein Y is the tracer.
Essentially, a displacement assay will be used. However, it will be important to choose concentrations of the untagged protein that are centered around the expected Kd, in order to derive an accurate IC50. Ideally, a range of concentrations of untagged protein ranging from 0.01X to 100X the Kd would be used. If the expected Kd is not known, it may be necessary to perform two experiments – one using a very broad range of untagged protein concentrations, then once this data has been evaluated, a second experiment can be set up using a narrower concentration of untagged protein. Additionally, it is advisable to test the assay with two or more different concentrations of tagged proteins (that still adhere to the two criteria above) to see if the IC50 changes significantly, depending on the tagged protein concentration. If the IC50 does vary dramatically between the two concentrations tested, it is likely the lower concentration is more accurate – the assay may need to be re-run with still lower concentrations of tagged protein.
Sample data:
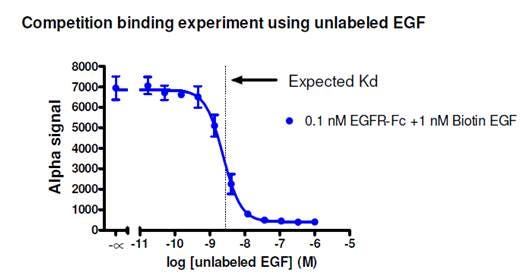
Figure 3. Competition binding assay to determine Kd for a biotinylated murine EGF/human EGFR-Fc protein-protein interaction. Streptavidin Donor beads and Protein A AlphaLISA Acceptor beads were used in this assay. Untagged EGF was titrated from 0.1 pM to 1 μM. The expected Kd is ~2.8 nM as determined by a radioligand binding assay (Lax, I. et al. 1988). Based on the data, the calculated IC50 is 2.4 nM. View protocol for assay here.
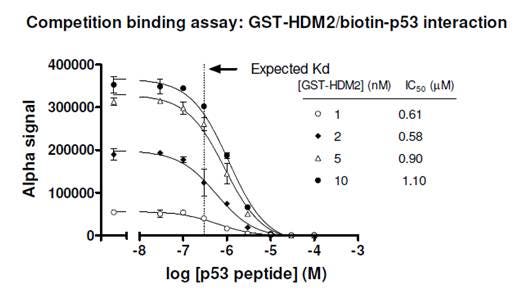
Figure 4. Competition binding assay to determine Kd for a biotinylated p53/GST-HDM2 protein-protein interaction. Streptavidin Donor beads and anti-GST AlphaScreen Acceptor beads were used in this assay. A few concentrations of tagged protein (GST-HDM2) were tested, and the IC50 values derived were fairly consistent. Untagged p53 was titrated from 30 nM to 100 μM. Concentration of biotinylated p53 used in the assay was 10 nM. The expected Kd for this interaction is ~ 0.3 μM (Dawson, R. et al., 2003). Compare to Figure 2, where data derived from a saturation curve erroneously gave a Kd of ~2 nM.
An excellent example of the use competition binding curves to determine affinity in an Alpha assay format is in a paper by Lazar et al., (2006). The IC50 of the interaction between three Fc variant antibodies and Fcgamma receptor was determined to be 380 nM, 60.3 nM, and 7.94 nM, respectively. These IC50s were in close agreement with SPR (surface plasmon resonance)-derived Kd values (252 nM, 30 nM, and 2 nM, respectively).
Table
Table: Relative capacities of various beads (beads used at 20 μg/mL final concentration in assay).
|
Bead coating |
Used to bind/capture |
Molecule and partner bead used to determine theoretical binding capacity |
Theoretical binding capacity1(provided for relative comparison) |
|---|---|---|---|
|
Streptavidin |
Biotinylated peptides, proteins, oligos, sugars, small molecules, etc. |
Biotinylated peptide |
30 nM |
|
Strep-Tactin® |
Strep-Tag® II and One-STrEP tagged proteins/peptides |
One STrEP-azurin-6X His with nickel chelate beads (100 nM) |
|
|
Anti-GST antibody |
GST-fusion proteins and peptides |
Biotinylated GST with streptavidin bead |
3 nM |
|
Anti-6X His antibody |
His-tagged proteins and peptides |
6X His-GST with glutathione bead |
100 nM |
|
Anti-FLAG antibody |
FLAG-tagged proteins and peptides |
Biotinylated FLAG with streptavidin bead |
100 nM |
|
Anti-maltose binding protein (MBP) antibody |
MBP-tagged proteins |
Biotinylated MBP with streptavidin bead |
1 nM |
|
Anti-HA antibody |
Hemagluttinin-tagged proteins and peptides |
Biotinylated-PEG-HA with streptavidin bead |
10 nM |
|
Anti-c-myc antibody |
c-myc-tagged proteins and peptides |
Biotinylated c-myc with streptavidin bead |
100 nM |
|
Anti-DIG antibody |
Digoxigenin labeled proteins, peptides oligos, etc. |
Biotinylated digoxigenin with streptavidin bead |
1 nM |
|
Anti-FITC antibody |
FITC or fluorescein-labeled proteins, peptides, oligos, sugars, small molecules, etc. |
Biotinylated-ERE-FITC with streptavidin bead |
>1 nM |
|
Anti-V5 antibody |
V5-tagged proteins/targets |
Biotin-Chromalink V5 (14 aa) with streptavidin bead |
~3 nM |
|
Anti-GFP antibody |
GFP-tagged (green fluorescent protein-tagged) proteins and peptides |
Biotinylated GFP with streptavidin beads |
3 nM |
|
Glutathione (GSH) |
GST-fusion proteins and peptides |
6X His-tagged GST with nickel chelate bead |
300 nM -1 μM |
|
Nickel chelate (Ni2+) |
His-tagged proteins and peptides |
6X His-tagged GST with glutathione bead |
300 nM -1 μM |
|
Protein A |
Antibodies2 |
Biotinylated rabbit IgG with streptavidin bead |
3 nM (antibody3) |
|
Protein G |
Antibodies4 |
Biotinylated rabbit IgG with streptavidin bead |
1 nM (antibody3) |
|
Protein L |
Antibodies5 |
Biotinylated human IgG (kappa) with streptavidin bead |
1 nM (antibody3) |
|
Anti-human IgG |
Fc portion of human IgG antibodies |
Biotinylated human IgG with streptavidin bead |
3 nM (antibody3) |
|
Anti-rabbit IgG |
Fc portion of rabbit IgG antibodies |
Biotinylated rabbit IgG with streptavidin bead |
1 nM (antibody3) |
|
Anti-mouse IgG |
Fc portion of mouse IgG antibodies |
Biotinylated mouse IgG with streptavidin bead |
3 nM (antibody3) |
|
Anti-mouse IgM |
Mouse IgM immunoglobulins |
Biotin-mouse IgM with streptavidin bead |
0.3 nM (antibody3) |
|
Anti-rat IgG |
Fc portion of rat IgG antibodies |
Biotinylated rat IgG with streptavidin bead |
1 nM (antibody3) |
|
Anti-sheep IgG |
Fc portion of sheep IgG antibodies |
Biotinylated sheep IgG with streptavidin beads |
1 nM (antibody3) |
|
Anti-goat IgG |
Fc portion of goat IgG antibodies |
Biotinylated goat IgG with streptavidin bead |
3 nM (antibody3) |
|
Anti-chicken IgY |
Fc fragment of chicken IgY immunoglobulins |
Biotinylated chicken IgY with streptavidin beads |
0.3 nM (antibody3) |
- The numbers provided are examples given to compare relative bead capacities, and are derived from probe titration experiments, as shown in the QC data on the product tech data sheets. The actual bead capacity for your bead system should be determined empirically for a given assay. The bead capacities given in this table are influenced by partner bead and the size of the probe used in these assays. The actual bead capacity will be influenced by size of the protein associating with the bead, as well as affinity of the protein (or antibody) for the bead.
- Protein A interacts strongly with particular subclasses of antibodies, including human IgG1, IgG2, and IgG4; mouse IgG2A and IgG2B; and rabbit, human and mouse total IgG. Protein A also has weaker affinity for other antibody subclasses. The affinity depends on the isotype and species of the antibody associating with the bead. Pierce has a nice chart that may be helpful.
- The bead capacity for these products refers to the capacity for antibody. The amount of protein you will then be able to bind to the antibody on the bead will be dependent on the affinity of your antibody for your protein and the size of your protein, and may range anywhere from 1 pM to 1 μM.
- Protein G binds to all subclasses of human IgG and mouse IgG. In addition it binds to rat, goat, sheep, guinea pig, rabbit, cow, pig and horse antibodies. Pierce has a nice chart that may be helpful.
- Protein L binds efficiently total human IgG, IgM, IgA, IgE, IgD, mouse IgG and rat IgG. It binds only poorly mouse IgM and rabbit IgM and it does not bind human IgG (lambda light chain), rabbit, sheep, goat and bovine IgG and rat IgM. Pierce has a nice chart that may be helpful.
For research use only. Not for use in diagnostic procedures.