


Overview
AlphaLISA™ is a bead-based assay technology that can be used for immunoassays in a microplate format. A key feature of this assay is that it is a homogeneous, or a “no wash” assay. This feature combined with its sensitivity and high throughput capabilities make Alpha an assay format choice for many research applications. As many researchers wish to apply this technology to samples containing serum, the content below will serve as a guide to optimizing this type of assay.
Some topics that will be considered include:
- Studies using serum or blood samples
- Hemolyzed samples and potential for sample interference
- Finding a suitable matrix for your standard curve
Both serum and plasma originate from whole blood. Plasma is richer than serum as it contains everything but cells, including fibrinogen and coagulation factors. Researchers may wish to harvest plasma and use agents such as heparin or chelators such as EDTA to prevent blood clotting. Both EDTA and heparin were shown not to affect the Alpha Technology. The serum is more stable and more uniform. Other biological fluids such as cerebrospinal fluid (CSF), bronchoaveolar lavage fluid (BALF), amniotic fluid (AF), saliva or urine are often used to measure biomarkers. Each of these fluids has a unique protein composition and will require specific validation. The goal of the document is to guide you through this specific validation approach.
Working with a complex sample such as serum or CSF may sometimes result in decreased assay sensitivity. However, in most cases, working with these biological matrices is successful if the appropriate procedures are followed.
Matrix Importance
For quantitation of an analyte in your samples, it is necessary to create a standard curve of your analyte in a matrix that closely matches your samples. For example, if you are working with serum samples, you will need to create a standard curve of your analyte in analyte-depleted serum or something similar, such as fetal bovine serum (FBS). A spike-and-recovery experiment should be performed to assess whether a proposed matrix is suitable for your sample type. Table1 provides some examples of possible matrices.
| Sample type | Possible matrices (diluents) for standard curve |
|---|---|
| Serum | FBS (or analyte-depleted serum) |
| Cell supernatant | The same culture media as used to treat your cells |
| Cell lysate | Lysis buffer (we recommend AlphaLISA lysis buffer, #AL003, for creating lysates) |
| Unusual sample types (cerebrospinal fluid, amniotic fluid, etc.) | Various diluents should be tested. In some cases, where a perfect match for the fluid cannot be found, sample dilution may be required. For example, you may need to dilute your sample 2-fold in 1X PBS + 0.1% BSA, then run your standard curve in 1X PBS + 0.1% BSA. |
Table 1: Possible matrices for standard curve by sample type.
There is a correlation between recovery and matrix. When the matrix for your standard matches the sample matrix, the percentage of recovery is better. Figures 1 & 2 illustrate matrix importance and percent recovery. It is important that the matrix should be as close to the sample as possible.
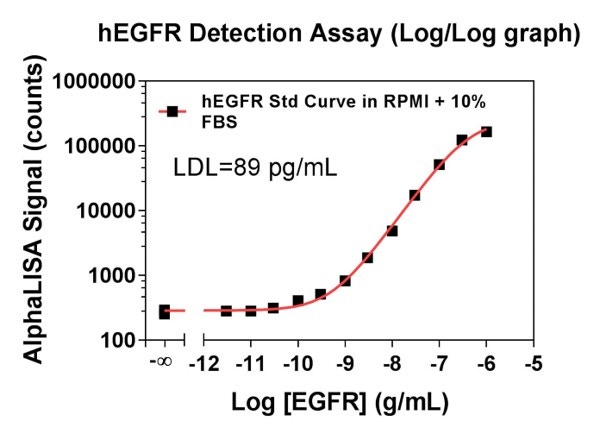
| Sample in immunoassay buffer | Spiking conc. (pg/mL) | Detected (pg/mL) | % recovery |
|---|---|---|---|
| 1 | 50,000 | 39,996 | 80 |
| 2 | 10,000 | 10,017 | 100 |
| 3 | 100 | 62 | 62 |
| Sample in RPMI + 10% FBS | Spiking conc. (pg/mL) | Detected (pg/mL) | % recovery |
| 4 | 50,000 | 20,016 | 40 |
| 5 | 10,000 | 4,847 | 48 |
| 6 | 100 | not detectable |
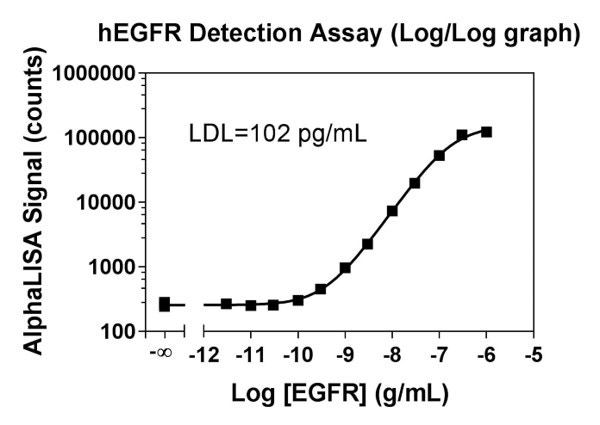
Figure 1: A hEGFR detection assay with a standard curve prepared with Immunoassay Buffer (IAB). Data show comparative values of percent recovery with two different sample matrices. As the standard curve was prepared in IAB, the percent recovery is better for the IAB samples, as compared to the sample prepared with RPMI + 10% FBS.
In Figure 2, the standard curve was instead run in RPMI + 10% FBS. Data show percentage recoveries are better with spike-ins prepared in RPMI + 10% FBS.
| Sample in immunoassay buffer | Spiking conc. (pg/mL) | Detected (pg/mL) | % recovery |
|---|---|---|---|
| 1 | 50,000 | 74,943 | 150 |
| 2 | 10,000 | 15,331 | 153 |
| 3 | 100 | 161 | 161 |
| Sample in RPMI + 10% FBS | Spiking conc. (pg/mL) | Detected (pg/mL) | % recovery |
| 4 | 50,000 | 48,440 | 97 |
| 5 | 10,000 | 9,935 | 99 |
| 6 | 100 | 57 | 57 |
Figure 2. The standard curve is prepared with RPMI + 10% FBS. Data show only the spike-in concentrations made with RPMI + 10% FBS showed acceptable recoveries; the ones prepared in IAB did not.
In a third experiment, a standard curve for human IL6 was performed in both IAB and FBS. The results are shown in Figure 3.
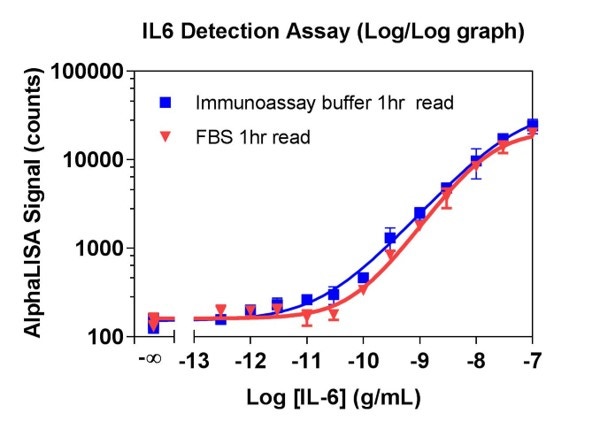
Figure 3. The human IL-6 standard curve was prepared and plotted in both immunoassay buffer and FBS. The curve in FBS shifted to the right, which indicates the reason for different percent recoveries in the different matrices.
There are several standard curve matrix options that can be used when working with serum samples in an Alpha format. These include:
- Using FBS with or without sample dilution
- Preparing analyte-depleted serum
- Buying or custom requesting analyte depleted serum (companies such as Scipac® sell analyte-depleted serum)
- Using charcoal-stripped serum as a matrix for some analytes
- Pooled normal serum may be used (Petersen et al. 2010) only if it does not contain a detectable level of analyte being tested
Potential For Sample Interference
When working with serum or plasma, hemolysis is a factor to consider. Hemoglobin absorbs light in the same range as Alpha beads emit light and can cause interference.
Figure 4 shows different wells with varying amounts of hemoglobin spiked in immunoassay buffer. Based on normal red blood cell (RBC) counts and hemoglobin content in a RBC, the spiked hemoglobin amounts were converted to the approximate hemolysis percentage of RBC. This is a visual representation comparing the amount of hemoglobin and the percent hemolysis in regard to well color.
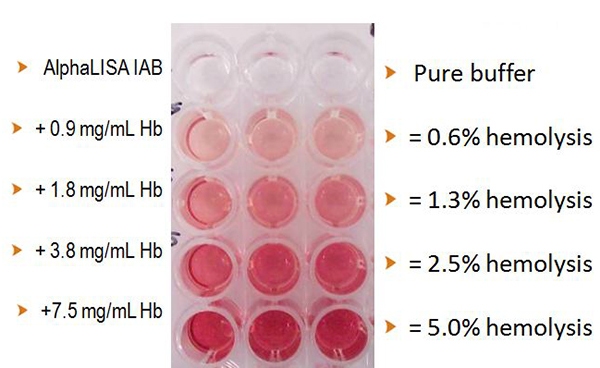
Figure 4. Comparison between the amount of hemoglobin added as it correlates to the percentage of hemolysis with an AlphaLISA assay.
In order to better determine the effect of hemoglobin on an AlphaLISA assay, a sample was spiked with increasing concentrations of hemoglobin and was measured using the Human Amyloid β 1-40 Immunoassay Kit. The assay was performed as stated in the manual using 5 μl of sample, 20 μl AlphaLISA Acceptor beads/biotinylated antibody and 25 μl of Donor beads.
- The buffer was spiked with 16,000 pg/mL of Aβ 1-40 and increasing concentrations of hemoglobin
- The plates were read with an EnVision™ 2104 Multilabel plate reader HTS with Alpha option
- The interpolated values (as shown in Table 2) were determined from the Immunoassay Buffer (IAB) standard curve
| Hb (mg/mL) | % hemolysis | Interpolated (pg/mL) | % recovery |
|---|---|---|---|
| 0.0 | 0.0% | 16,544 | 100 |
| 0.9 | 0.6% | 18,729 | 113 |
| 1.9 | 1.3% | 16,740 | 101 |
| 3.8 | 2.5% | 13,805 | 83 |
| 7.5 | 5.0% | 7,198 | 44 |
Table 2: Percent recovery for assay samples with varying amounts of hemoglobin. With the addition of 3.8 mg/mL hemoglobin, the percent recovery was 83%. Therefore, a sample containing up to 3.8 mg/mL of hemoglobin, or approximately equivalent to 2.5% hemolysis, may be measured using the AlphaLISA Amyloid β 1-40 kit.
For key AlphaLISA references where serum samples were used, please refer to the References and Citations section following.
Other components of a sample matrix can also potentially interfere with the assay. Interference may result from cross-reactivity of antibodies to a component in the serum sample, depletion of the spiked analyte, or variable levels of IgG, albumin or other proteins.
Serum often contains high concentrations of many components including:
- Hemoglobin
- Bilirubin
- Transferrin
- IgG and other immunoglobulins
- Triglycerides and other lipids
- Biotin and biotinylated proteins
- Binding proteins/Receptors
- Related immunogens detected by either one antibody or two antibodies
Reducing sample to sample variability is a critical step in optimizing an AlphaLISA assay using serum samples. There are several factors to examine when attempting to improve percent recovery for an assay. Some suggestions to improve percent recovery include but are not limited to:
- Diluting the serum samples 2X with FBS
- Removing IgG
- Reducing heterophilic interference by using commercial blockers
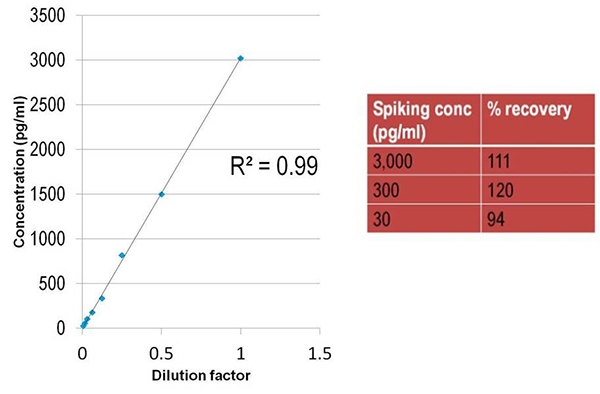
Figure 5. The good recoveries obtained for TNFα with a 1/2 diluted pooled serum as a matrix.
The above experiment was repeated using insulin instead of TNFα, as shown in Figure 6.
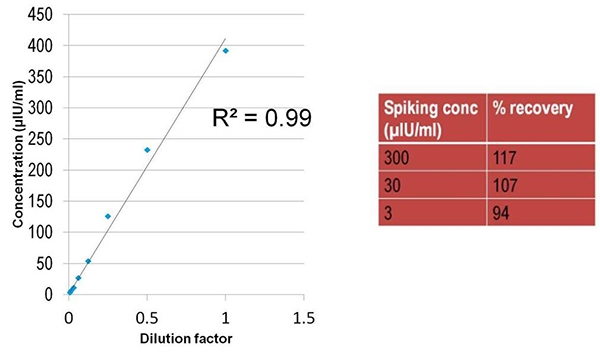
Figure 6. Good insulin recovery obtained using 1/2 diluted serum as a matrix.
As we have previously mentioned, serum is made up of many biological components that could potentially interfere with an assay. When using serum samples with the AlphaLISA kits, dilutions may need to be made based on kit parameters. In most cases, potential interference issues can be resolved by diluting the sample or changing the assay buffer.
Identifying Diluents For Any Matrix
The following section describes how to identify a correct diluent for complex sample matrices based on examples from various animal fluids. There were three cytokines selected: IL6, TNFα, and MCP-1 (CCL2). The four sample matrices selected were mouse serum, mouse bronchial lavage fluid (BALF), rat cerebrospinal fluid (CSF) and rat amniotic fluid (AF).
The assay was performed as indicated in the manual. The protocol is listed below along with the calibration curve for mouse MCP-1.
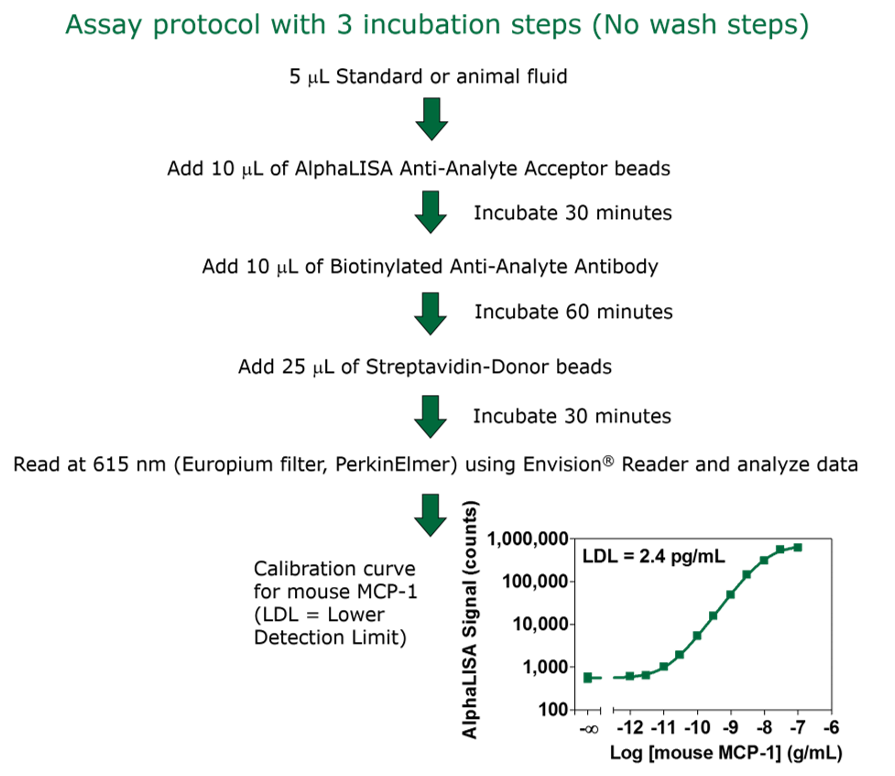
Protocol
To begin assay development using a new matrix, one must first identify an appropriate matrix (or "diluent") for the standards. Linearity experiments and spike-and-recovery experiments were performed to assess whether each proposed matrix is suitable for these sample types. A protocol example may be found in the Application Notes and Poster section below. In Figure 7, the linearity of dilutions in five diluents for spiked mouse BALF (3 ng/mL mTNFα) were examined.
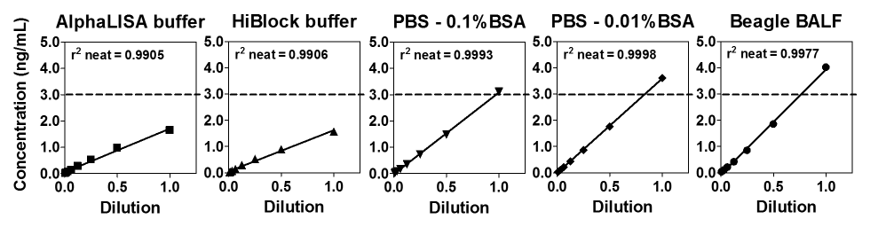
Figure 7. Linearity of five different diluents was determined.
A good diluent will exhibit good recovery (values between 70% and 130%) and linearity (no change upon dilution). In this case, the two best choices are PBS + 0.1% BSA and PBS + 0.01% BSA as demonstrated in Table 3.
| AlphaLISA buffer | HiBlock buffer | PBS + 0.1% BSA | PBS + 0.01% BSA | Beagle BALF | |
|---|---|---|---|---|---|
| Dilution factor (DF) | Recovery from neat (%) | Recovery from neat (%) | Recovery from neat (%) | Recovery from neat (%) | Recovery from neat (%) |
| 1 | 100 | 100 | 100 | 100 | 100 |
| 2 | 119 | 113 | 95 | 97 | 92 |
| 4 | 128 | 135 | 93 | 96 | 85 |
| 8 | 137 | 150 | 90 | 96 | 82 |
| 16 | 139 | 146 | 92 | 95 | 83 |
| 32 | 149 | 145 | 94 | 99 | 83 |
Table 3: Linearity results with varying diluents.
To decide which of these two diluents would work best, a spike-and-recovery experiment was performed. Shown in Table 4 are the spike-and-recovery results using PBS + 0.1% BSA as diluents.
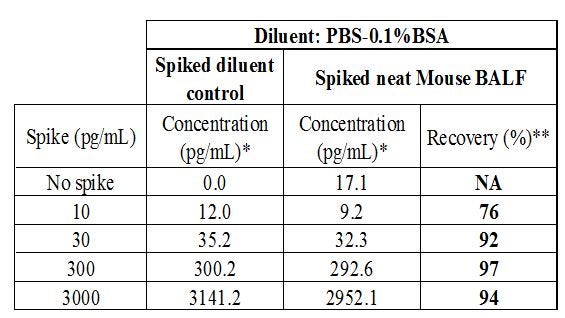
Table 4: Excellent recovery was obtained for all four spike concentrations tested. The recovery percentage is equal to the recovery compared to the spiked diluent control.
[*] Concentration for 10 to 3000 pg/mL spikes = measured concentration - no spike value
[**] Recovery (%) = recovery compared to spiked diluent control
For certain sample types, dilutions may be required to achieve good linearity results. In another set of experiments, five diluents were examined for linearity when spiked with 3 ng/mL of mMCP-1 rat AF. In the below chart, the rat amniotic fluid required further sample dilution in order to achieve good linearity. This sample differs from the mouse BALF as shown in Figure 7 which did not require a 2x dilution for good results. It may be necessary to use dilutions to make the samples comparable to the sample being tested.
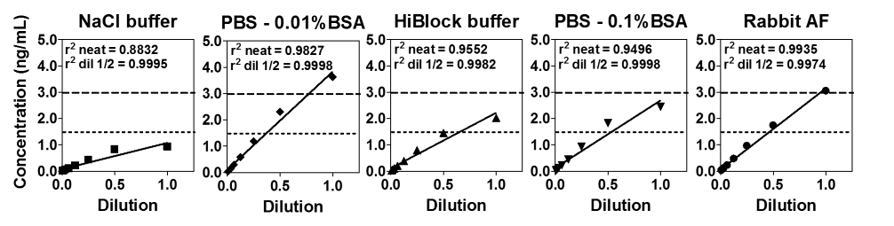
Figure 8. Linearity of five different diluents was determined.
Good recovery (values between 70% and 130%) and linearity (no change upon dilution) are expected once the correct dilution has been determined. Table 5 summarizes the recovery results obtained.
| NaCl buffer | PBS + 0.01% BSA | HiBlock buffer | PBS + 0.1% BSA | Rabbit AF | ||||||
|---|---|---|---|---|---|---|---|---|---|---|
| Dilution factor (DF) | Recovery from neat (%) | Recovery from 1/2 dil. (%) | Recovery from neat (%) | Recovery from 1/2 dil. (%) | Recovery from neat (%) | Recovery from 1/2 dil. (%) | Recovery from neat (%) | Recovery from 1/2 dil. (%) | Recovery from neat (%) | Recovery from 1/2 dil. (%) |
| 1 | 100 | 100 | 100 | 100 | 100 | |||||
| 2 | 179 | 100 | 127 | 100 | 144 | 100 | 149 | 100 | 114 | 100 |
| 4 | 187 | 104 | 131 | 103 | 157 | 109 | 152 | 102 | 126 | 110 |
| 8 | 180 | 100 | 129 | 101 | 154 | 107 | 145 | 98 | 123 | 108 |
| 16 | 170 | 95 | 129 | 101 | 163 | 113 | 150 | 100 | 116 | 102 |
| 32 | 192 | 107 | 129 | 101 | 169 | 117 | 148 | 100 | 119 | 104 |
Table 5. Tabular results for spiked rat AF assay.
Not a single diluent gave acceptable results from the neat sample, but upon a 1:2 dilution, the two diluents with the best results are HiBlock buffer and PBS with 0.1% BSA, as highlighted by stable recoveries upon dilution and values close to 100%. The diluent showing the best spike-and-recovery was further examined. The concentration for 300-3000 pg/mL spikes is equal to the measured concentration minus the no spike value. The percent recovery is calculated by dividing the value in the sample by the value obtained in the spiked diluent control.
|
Diluent: PBS + 0.1% BSA |
|||||
|---|---|---|---|---|---|
| Spike diluent control | Spiked neat Rat AF | Spiked 1/2 Rat AF | |||
| Spike (pg/mL) | Observed concentration (pg/mL)* | Observed concentration (pg/mL)* | Recovery (%)** | Observed concentration (pg/mL)* | Recovery (%)** |
| No spike | 0.0 | 910.5 | NA | 575.6 | NA |
| 300 | 267.3 | 195.2 | 73 | 317.2 | 119 |
| 1,000 | 890.5 | 442.6 | 50 | 750.4 | 84 |
| 3,000 | 2,627.6 | 1,542.0 | 59 | 2,227.9 | 85 |
Table 6. The ½ dilution in diluent required proved excellent recovery for all 3 spikes tested in ½ rat AF, but not in neat rat AF. The measured MCP-1 physiological level in rat AF (No spike) = 575.6 pg/mL X 2 = 1151 pg/mL.
[*] Concentration for 300 to 3000 pg/mL spikes = measured concentration - no spike
[**] Recovery (%) = recovery compared to spiked diluent control
In summary, three cytokines were examined using various sample fluids and diluents. As seen in the below table, lower detection limits were determined along with dilution, spike range and physiological level measured.
| Analyte | Sample fluid | Best diluent | LDL in diluent (pg/mL) | Dilution of sample fluid required in diluent | Physiological level measured (pg/mL) | Spike range in sample fluid giving good recovery (pg/mL) |
|---|---|---|---|---|---|---|
| Mouse IL-6 | Mouse serum | FBS | 2.1 | 1/2 | 33 | 30 - 10,000 |
| Mouse BALF | PBS + 0.1% BSA | 2.4 | Neat | 22 | 10 - 3,000 | |
| Rat CSF | Beagle CSF | 3.4 | Neat | ND | 10 - 3,000 | |
| Rat AF | PBS + 0.01% BSA | 2.9 | 1/2 | ND | 10 - 3,000 | |
| Mouse TNFα | Mouse serum | FBS | 1.6 | 1/2 | 55 | 30 - 3,000 |
| Mouse BALF | PBS + 0.1% BSA | 1.6 | Neat | 17 | 10 - 3,000 | |
| Rat CSF | PBS + 0.1% BSA | 1.4 | Neat | ND | 3 - 3,000 | |
| Rat AF | PBS + 0.01% BSA | 1.4 | 1/2 | 5 | 3 - 3,000 | |
| Mouse MCP-1 | Mouse serum | FBS | 5.4 | 1/2 | 444 | 300 - 3,000 |
| Mouse BALF | Beagle BALF | 5.7 | Neat | 501 | 100 - 3,000 | |
| Rat CSF | PBS + 0.1% BSA | 2.9 | Neat | 501 | 100 - 3,000 | |
| Rat AF | PBS + 0.01% BSA | 2.4 | 1/2 | 1,151 | 300 - 3,000 |
Table 7. Summary of serum samples and diluent matrices.
Previously published data comparing different serum matrices is included in the table below. Specifically, the physiological level of serum as shown in the above AlphaLISA data in Figure 16 has been compared with the physiological range as reported in the literature. For most sample types, the AlphaLISA results match well with the physiological ranges reported in the literature.
| Physiological range found in literature (pg/mL) | ||||
|---|---|---|---|---|
| Cytokine | Mouse serum | Mouse BALF | Rat CSF | Rat AF |
| IL-6 | 5 - 70 | 20 | Not found | 10 - 60 |
| TNFα | 5 - 100 | 30 - 90 | Not found | 10 - 60 |
| MCP-1 | 30 - 1,500 | 40 | Not found | 1,500 |
Table 8. Physiological ranges of serum matrices as cited in literature.
Summary
While assay interference is not a general issue with AlphaLISA technology, there is potential that components in complex biological matrices may impact the measured values. The above information is meant to serve as an assay development guide for using Alpha technology with such complex matrices. The assay may require some optimization, including verification that the control matrix is as similar to the sample as possible, selecting appropriate diluent buffer, as well as optimizing the spiking concentration for accurate recovery determinations.
The key points to note when working with serum and other biological matrices in an AlphaLISA assay are as follows.
- Components of a sample matrix may potentially interfere with an assay.
- The standard curve of your analyte should be created in a matrix that closely matches the samples.
- Linearity and spike-and-recovery experiments should be performed to determine if a suggested matrix is suitable for the samples.
- Sample dilutions may be required in some cases to achieve good results.
References
Poulsen F and Jensen KB. A Luminescent Oxygen Channeling Immunoassay For The Determination Of Insulin In Human Plasma. J. Biomol. Screen. 12(2), 2007. Link
Petersen, SB et al. Comparison Of Luminescent Oxygen Channeling Immunoassay And ELISA For Detecting Insulin Aspart In Human Serum. J. Pharmaceutical and Biomedical Analysis 51 (2010). Link
For research use only. Not for use in diagnostic procedures.
The information provided above is solely for informational and research purposes only. Revvity assumes no liability or responsibility for any injuries, losses, or damages resulting from the use or misuse of the provided information, and Revvity assumes no liability for any outcomes resulting from the use or misuse of any recommendations. The information is provided on an "as is" basis without warranties of any kind. Users are responsible for determining the suitability of any recommendations for the user’s particular research. Any recommendations provided by Revvity should not be considered a substitute for a user’s own professional judgment.