Introduction to Trypan blue and Acridine Orange/Propidium Iodide staining methods
Determining cell viability is a vital component in many biological experiments that range from standard cell culture to the investigation of pharmacological agents on tumor cells. One of the earliest and most common methods for measuring cell viability is the Trypan blue (TB) exclusion assay[1, 2]. Over the last two decades, there have been various publications comparing TB exclusion and fluorescence-based cellular viability assays[1, 3-5]. Previous results have shown that in a time-course measurement, TB exclusion assays reported significantly higher viabilities when compared to fluorescence-based methods[4, 5]. These previous studies have shown comparison results but did not provide evidence on potential reasons for the differences. In this work, we performed a time-course study to compare cellular viability measured with TB and Acridine orange/propidium iodide (AO/PI) using an automated image-based cytometry method.
Materials and methods
Acridine orange (AO) and propidium iodide (PI) are nucleic acid binding dyes that can be used to measure cell viability. Since AO is cell permeable, all stained nucleated cells generate a green fluorescence. PI only enters cells with compromised membranes and therefore dying, dead, and necrotic nucleated cells stained with PI generate a red fluorescence. When cells are stained with both AO and PI, live nucleated cells only fluoresce green and dead nucleated cells only fluoresce red. This is due to Förster resonance energy transfer (FRET); where the PI signal absorbs the AO signal producing no spill-over or double positive results. Additionally, other membrane-exclusion viability dyes such as: ethidium bromide (EB), 7AAD, SYTOX green/red, DRAQ5 and others may also be used instead of PI. Cell viability is calculated by examining the ratio of the number of live to the number of dead fluorescing cells. This assay can be used to measure the viability of nucleated cells in cell culture and purified samples and also in complex samples such as PBMC, whole blood, bone marrow, bronchoalveolar lavage, tumor digests, primary samples and many more.
Jurkat cell preparation
Jurkat cells were cultured in RPMI-1640 medium. For a viability comparison of room temperature-incubated cells, one flask was taken out of the incubator and placed into a bench-top drawer. The flask was kept at room temperature for the remainder of the experiment. A small aliquot of cells was removed from the flask at the following time points: 0, 6, 12, 24, 48, 72, 96, and 168 h. A similar experiment was conducted to study the effect of different TB concentrations on Jurkat cell viability, which was measured at the following time points: 0, 3, 6, 9, 12, 27, and 33 h. (The time points were shorter than the first experiment because it was targeted towards the time frame where the viability difference, shown here in Figure 2, was most apparent.) For a heat shock viability comparison, Jurkat cells were placed in boiling water for 15 min. After heat shock, five samples were prepared at viabilities of 0, 25, 50, 75, and 100% by mixing the heat-killed and fresh Jurkat cells at the appropriate volumes.
Time-course viability of room temperature-incubated Jurkat cells
The viability and concentration of the room temperature-incubated Jurkat cells were determined and compared using four detection methods: (1, 2) measuring viability staining with PI or AO/PI and counting with a Cellometer™ Vision* instrument, (3) staining with 0.4% TB and counting with a Cellometer Auto T4 instrument, and (4) staining with 0.4% TB and manual counting with a hemocytometer. The AO/PI staining procedure was performed as previously described [6]. Room temperature-incubated cell samples at 0, 6, 12, 24, 48, 72, 96, and 168 h were mixed with PI, AO/PI, or TB, and analyzed immediately with a Cellometer Vision, Cellometer Auto T4, and a hemocytometer. The viability and concentration were measured in quadruplicate for all time points.
Trypan blue concentration-dependent viability comparison
The effect of TB concentration on viability of room temperature-incubated Jurkat cells was determined and compared using two detection methods: (1) measuring viability by AO/PI and counting with Cellometer Vision*, and (2) staining with various concentrations of TB and manual counting with a hemocytometer. Each room temperature-incubated cell sample at 0, 3, 6, 9, 12, 27, and 33 h was mixed with AO/PI or 0.4, 0.2, 0.1, 0.05, 0.025, 0.0125% of TB and analyzed immediately with Cellometer Vision* and a hemocytometer. The viability and concentration were measured in quadruplicate for all time points.
Heat shock viability comparison
Freshly collected Jurkat cells were separated into two equal aliquots, one was heat shocked by boiling the samples for 15 min (100% non-viable) and the other was not (100% viable). The cells from these two aliquots were then mixed at different ratios to produce cell suspensions. The viability and concentration of each heat-shocked/live viability mixture (0, 25, 50, 75 and 100%) was determined and compared using three detection methods: (1) Measuring viability staining with PI and counting with Cellometer Vision*, (2) staining with 0.4% TB and counting with Cellometer Auto T4, and (3) staining with 0.4% TB and manual counting with a hemocytometer. Each heat-shock/live mixture sample was mixed with PI or TB and analyzed immediately with image cytometer and hemacytometer. The viability and concentration for each of the three independent experiments were measured in quadruplicate for all five mixtures.
Image cytometry automated cell-counting protocol
Jurkat cells stained with PI, AO/PI, or TB were pipetted immediately after mixing into a disposable counting chamber. The Cellometer Vision* utilizes fluorescence (FL) optics modules of VB-535- 402 (pseudo-color green) and VB-660-503 (pseudo- color red) to detect AO and PI, respectively. The Cellometer Auto T4 uses a color camera to detect TB stained Jurkat cells. For TB image analysis, live cells with bright center and dark cells stained with TB in the brightfield (BF) were enumerated. For PI image analysis, total cells in the BF and dead cells in the FL channel were enumerated. For AO/PI image analysis, AO-stained live cells and PI-stained dead cells in green and red FL channels were enumerated.
Hemocytometer manual cell counting protocol
Jurkat cells stained with TB were pipetted immediately into a Neubauer hemocytometer. Live and dead cells were enumerated manually under light microscopy for samples from both controlled heat-shocked and room temperature-incubated Jurkat cells. Cell samples with an approximate 50% viability were used for manual counting.
*The Cellometer Vision has been superseded by the Cellometer Spectrum instrument.
Results

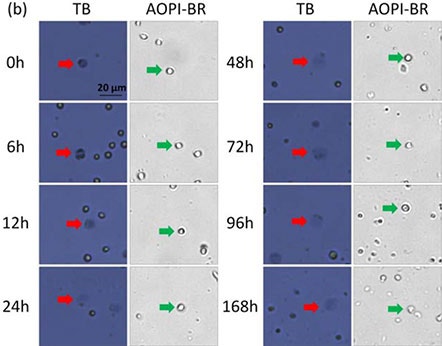
Figure 1. Time-course viability of room temperature-incubated Jurkat cells
Brightfield images of AO/PI and TB-stained room temperature-incubated Jurkat cells. Samples were measured at time points 0 – 168 h post incubation. Large, dim, and diffused cells in the BF images are shown with red and green arrows, respectively.
Cells from 0 to 12 h resembled those that were heat-shocked; outer cell membranes appeared to be dark and well defined. By 168 h, cells now appeared gray and undefined. Similar morphological characteristics were observed, where cell membranes changed from well-defined (tight and darkly stained) to amorphous (large and diffuse).
While the number of TB-stained large, dim cells increased with time, the morphological characteristics of Jurkat cells stained with AO did not change over the same period of time. We visually confirmed that the number of stained (AO/PI and TB) dead Jurkat cells increased over time.
The most optimal method for measuring cell viability is the AO/PI method, which allows for dual-fluorescence detection (live and dead), thus reducing the potential inaccurate counting of membrane-poor cells populations: late apoptotic and necrotic cells, as well as reducing the counting of cellular debris.
The four detection methods showed clear differences between fluorescence-based and TB exclusion assays. (a)
A two-sample T-test was calculated at the 12 h time point comparing AO/PI to PI and AO/PI to TB staining. The results showed that AO/PI was comparable to the PI staining method (p > 0.05), while AO/PI was significantly different from TB counting (p ≤ 0.05).
At the 24 h time point, the viability measured by TB showed approximately 80%, while the AO/PI or PI showed 70%.
The total concentrations were also measured by the AO/PI and PI methods, which showed consistent results, whereas the TB method showed a gradual decrease over time. (b)
The live cell concentrations were measured and showed no differences between the two methods, however the dead cells showed higher concentrations for AO/PI and PI methods than the TB method over time. (c)
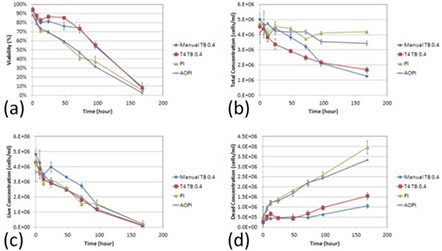
Figure 2. Concentration and viability time-course measurement of TB, PI, and AO/PI-stained room temperature-incubated Jurkat cells
By the end of the time trial, both the manual and TB measured concentrations were more than two times lower than the fluorescence-based detection methods. Furthermore, the initial deviation in the number of measured dead cells by TB began at 12 h post incubation at room temperature which is the same time at which the measured cell viability decreased to ~70% by AO/PI. These data suggest that as the cell viability decreases, the TB exclusion method undercounts the number of dead cells thereby producing an inflated viability measurement. (d)

Figure 3. Trypan blue concentration dependence viability comparison
In addition to the increase of large, dimly diffused shaped cells over time (0-33 h post incubation; red arrows), high concentrations of TB exhibited more of these cells in comparison to lower concentrations. (figure 3)
AO/PI staining remained consistent with the previous experiment, showing an increase in PI positive cells over the course of the experiment.
In figure 4, as before, the viabilities measured from each TB concentration were higher than the counts from AO/PI-stained cells. Similarly, the live cell concentrations were comparable to each other when a two-sample T-test was calculated for AO/PI against all TB concentrations (p > 0.05). The measured concentration of dead cells for each experimental parameter was significantly different (p ≤ 0.05) for AO/PI against all TB concentrations (b, c). And as in the previous time course experiment, even at high TB concentrations, we observe a considerably lower number of reported dead cells.
These data support not only our previous findings that TB viability measurement overestimates measured sample viability percentage, but also show that this phenomenon occurs at every tested TB concentration.

Figure 4. Trypan blue concentration dependence viability comparison
In figure 5, BF and FL images of TB and PI-stained heat-shocked Jurkat cells at various viability percentages. In these heat-shocked Jurkat samples, the TB images showed a clear distinction between live and dead cells, where the dead cells exhibited a tight dark and well-defined morphology. Similarly, the dead cells in the BF images maintained an easily detectable cellular membrane.
There were also clear morphological differences between the heat-shocked and room temperature-incubated cells. Because the heat-shocked cells did not undergo natural apoptotic cell death and necrosis, the stained Jurkat cells appear uniform in shape, color, and roundness. In contrast, cells that were incubated at room temperature (seen in Figure 3) exhibited non-uniform cellular morphology and non-uniform TB staining patterns.
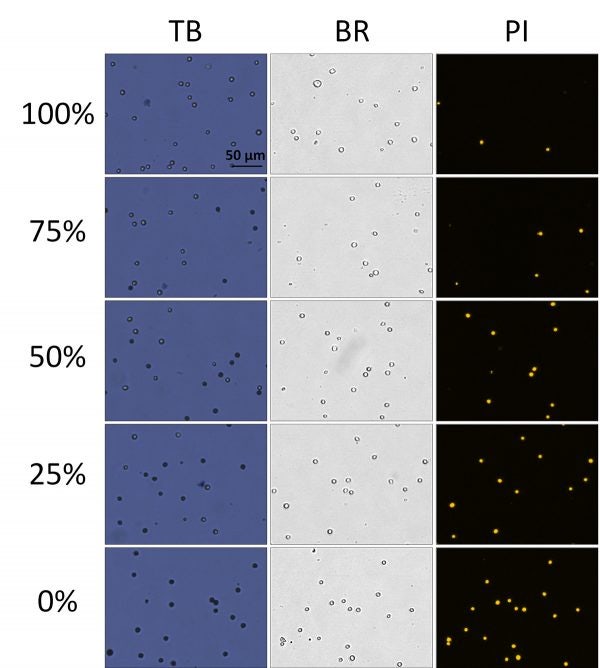
Figure 5. Viability comparison between heat-shocked and fresh Jurkat cells
Figure 5. shows time-course concentration measurement of large dim cells ("balloon") and dark tight (dead) shaped Jurkat cells at TB concentrations. (a) 0.4%, (b) 0.1%, and (c) 0.025%. (d) Concentration results (at 33 h post incubation at room temperature) showed that at higher TB concentration, the dim, diffuse cells or "balloons" were very high in number compared those in the lowest TB concentration.
Due to the morphological uniformity of heat-shocked cells, the viability counts between TB and PI showed a high degree of correlation across the theoretical viabilities. (Figure 6) In this experiment, PI was used instead of AO/PI due to the lack of cellular debris. In contrast, room temperature-incubated cells generated large amounts of cellular debris. As a result, AO/ PI was required to reliably determine the viability of nucleated cells in the sample without interference from the cellular debris [7].
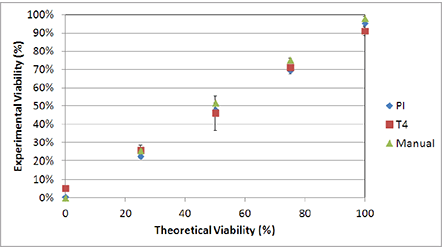
Figure 6. Viability comparison between heat-shocked and fresh Jurkat cells
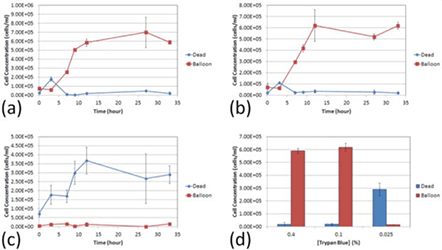
Figure 7. Time course and percentages of dim, "balloon" cells versus dead, "dark" cells at various TB concentrations
Conclusion
The purpose of this study was to investigate the differences and possible causes of those differences in viability measurements between the TB exclusion assay and fluorescence-based viability stains. Over the years, there have been numerous comparisons between the two viability detection methods, but the reports have not proposed any possible explanations for the morphological changes caused by TB.
The membranes of room temperature-incubated Jurkat cells underwent extreme changes during cell death. In samples with high viability, the TB-stained dead cells exhibited tight, dark, uniform characteristics. This observation suggests that even though the cells were permeable to TB, cellular membranes remained intact enough to retain the TB dye in the cytosol.
In samples with low viability, the TB-stained dead cells exhibited large, dim, non-uniform diffused characteristics, which suggests functional loss of cell membrane integrity. It appears that in those cells, TB was not contained within the cytosol, which led to the formation of the observed large, dim cells.
Because the dimmer cells may be difficult to count in a hemocytometer under light microscopy, the TB exclusion assay may artificially produce higher viability counts due to the unintended exclusion of dead cells. As a result, the measured viability between the two methods showed significant discrepancy, as high as 30%, where similar observations have been made in previous publications [5].
The morphological differences between room temperature-incubated and heat-shocked cells can also potentially explain the variations in viability reporting of comparison between TB and fluorescence-based methods.
In addition, we examined the potential morphological changes that may be caused by different concentrations of TB. Upon staining the cells with a higher concentration of TB (0.4%), we observed a rapid formation of large dim diffuse circular shapes (“balloons”; Fig. 7) that can be observed under light microscopy and using the Cellometer instrument. The balloons appear to vary in size and brightness, some more clearly diffuse than others.
At lower TB concentrations (0.025%), we did not observe many balloon-like cells (Fig. 7). At 0.025% TB, the concentration of the dye may be too low to adequately stain all dead cells. Even though the nature of the balloons made them difficult to count, the balloons were carefully identified and manually counted under a light microscope across the concentrations of TB. We observed that at the 33 h time point, for both 0.4 and 0.1% concentrations there are significantly higher number of diffused balloon cells than the dark dead cells (p ≤ 0.05, for both TB concentrations). At 0.025% concentration there was not only a reversal in the number of counted balloons versus the number of counted dead cells (p ≤ 0.05), but there was also a lower number of total counted cells; which can be attributed to low dye concentration.
Together these data suggest that TB, at high concentrations, has a morphological effect on membrane-compromised dead cells, thus producing balloon-like cells. At lower concentrations of TB these dye-induced effects were not observed.
Finally, because these dead cells appear as faint, diffused colored balloon structures they are very difficult to see and count, which leads to an overestimation of viability measurement in the sample.
Other potential reasons for the differences between TB and fluorescence-based method can also be hypothesized. For example, PI has been shown to enter cells earlier than TB, thus it has the potential to measure more dead cells. Also, since TB is a cytoplasmic dye that stains intracellular proteins, dying cells with variation in membrane degradation may not retain TB because of the loss of membrane integrity. As a result, the number of dead cells counted may be lowered which in turn can generate higher viability measurement. Meanwhile PI, an intercalating dye, binds to the nucleic acid of the cells and is retained within the nucleus regardless of membrane integrity. It is because of these properties that PI is routinely used to stain and identify late apoptotic and necrotic cell populations [8, 9].
References
- Altman, S.A., L. Randers, and G. Rao, Comparison of Trypan Blue Dye Exclusion and Fluorometric Assays for Mammalian Cell Viability Determinations. Biotechnology Progress, 1993. 9: p. 671-674.
- Louis, K.S. and A.C. Siegel, Cell Viability Analysis Using Trypan Blue: Manual and Automated Methods, in Mammalian Cell Viability: Methods and Protocols, M.J. Stoddart, Editor. 2011, Springer. p. 7-12.
- 3. Black, L. and M.C. Berenbaum, Factors Affecting the Dye Exclusion Test for Cell Viability. Experimental Cell Research, 1964. 35: p. 9-13.
- 4. Jones, K.H. and J.A. Senft, An Improved Method to Determine Cell Viability by Simultaneous Staining with Fluorescein Diacetate-Propidium Iodide. Journal of Histochemistry and Cytochemistry, 1985. 33(1): p. 77-79.
- Mascotti, K., J. McCullough, and S.R. Burger, HPC viability measurement: trypan blue versus acridine orange and propidium iodide. Transfusion, 2000. 40: p. 693-696.
- 6. Bank, H.L., Assessment of islet cell viability using fluorescent dyes. Diabetologia, 1987. 30: p. 812-816.
- Chan, L.L., et al., Accurate measurement of peripheral blood mononuclear cell concentration using image cytometry to eliminate RBC-induced counting error. J Immunol Methods, 2013. 388(1-2): p. 25-32.
- Denecker, G., et al., Phosphatidyl serine exposure during apoptosis precedes release of cytochrome c and decrease in mitochondrial transmembrane potential. FEBS Letters, 2000. 465: p. 47-52.
- Yedjou, C.G., et al., Basic apoptotic and necrotic cell death in human liver carcinoma (HepG(2) ) cells induced by synthetic azamacrocycle. Environmental Toxicology, 2012. 10.1002/tox.21786: p. 1-7.
For research use only. Not for use in diagnostic procedures.


