Overview
The "hook effect" (or "hooking effect") is a phenomenon common to bimolecular detection systems involving saturable reagents (beads, labeled antibodies, streptavidin, etc.) used to capture specific binding partners or analytes. Saturable bimolecular detection systems are typically exploited in homogeneous assays where two components (Donor and Acceptor) need to be brought in proximity to produce a signal. Proximity assay technologies such as FRET, BRET, PCA (protein complementation assays), AlphaLISA™, and AlphaScreen™ are representative examples of saturable bimolecular detection systems.
Contrasting with homogeneous assays, heterogeneous assay technologies are generally based on monomolecular detection systems where only one assay component, called the tracer, is required to produce a signal. Filtration binding assays involving radioactive or fluorescent tracers are good examples of monomolecular detection systems. Standard curves obtained using monomolecular detection systems show a typical sigmoidal shape ending by a plateau obtained at saturating tracer concentrations. These curves are also called saturations curves.
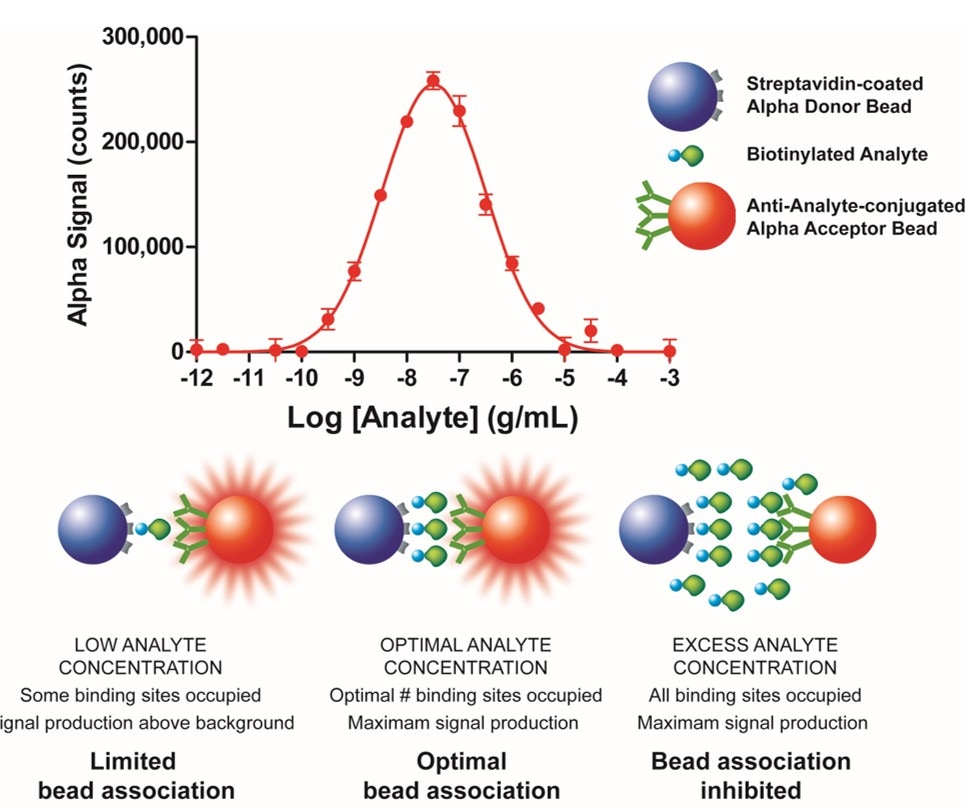
Standard curves produced with saturable bimolecular detection systems, such as AlphaScreen, are atypical. These curves are often bell-shaped and characterized by a titratable signal decrease (hook effect) following a plateau obtained after an initial concentration-dependent signal increase. The range of target molecules' (analytes or binding partners) concentrations where the signal starts to drop is called the hook point. Below the hook point, both Donor and Acceptor beads become progressively saturated by the target molecule and a signal increase is measured. At the hook point, either the Donor or the Acceptor component is saturated with the target molecule and a maximum signal is detected. Above the hook point, an excess of target molecules oversaturates the Donor and the Acceptor beads, which inhibits their association and causes a progressive signal decrease.

Example of the hook effect in an Alpha assay
For research use only. Not for use in diagnostic procedures.


