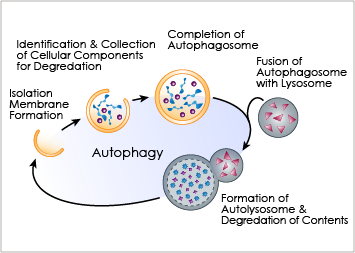
Introduction to autophagy
Autophagy is an important cellular catabolic process that plays a variety of important roles, including maintenance of the amino acid pool during starvation, recycling of damaged proteins and organelles, and clearance of intracellular microbes. First, the damaged proteins, organelles or foreign microbes are isolated by double membrane vesicles called autophagosomes. The vesicles then complete the enclosure of the damaged organelles and then fuses with lysosome. to form autolysosomes. Finally, the materials are degraded within the autolysosomes and the nutrients are recycled back to the cell. Currently employed autophagy detection methods include fluorescence microscopy, biochemical measurement and Western blotting, but they are time-consuming, labor-intensive, and require much experience for accurate interpretation.
By utilizing image cytometry, fluorescently labeled autophagosomes can be detected and measured via fluorescence analysis. The Cellometer Vision image cytometer has been used to demonstrate the detection and measurement of total fluorescence intensity of fluorescently labeled autophagosomes using proprietary stains (Cyto-ID® Green dye from Enzo Life Sciences) and GFP-LC3 protein in live cells.
The image cytometry method has been shown to generate comparable fluorescence intensity data to flow cytometry, which can be an alternative method to indicate the autophagy activity level in live cells. This can serve as a useful method to quickly assess autophagic response of live cells when treated with various chemical or biological reagents, as well as an alternative technique available in support of autophagy-based drug discovery relating to various pathological disorders.
*The Cellometer Vision system has been superseded by the Cellometer Spectrum.

Current detection methods for autophagy
Currently, the majority of the detection methods rely on the measurement of LC3-II proteins expressed on the autophagosomes. Below is a comparison table of current methods for detecting LC3-II for autophagy level.
| Autophagy detection methods | Method descriptions | Method drawbacks |
|---|---|---|
| Western Blot | Traditional protein analysis method to quantify the amount of LC3-II protein in the target cell sample. The protein band compared to the control will determine if autophagic activity exists. |
|
| Fluorescence Microscopy | An imaging method to qualitatively observe GFP-labeled autophagosomes or punctas. When the cells are autophagic, more autophagosomes are formed, thus more GFP-punctas appear. |
|
| Scanning Electron Microscopy | A high-resolution imaging method to qualitatively observe autophagosome particles inside the cells at high magnification. |
|
| Flow/image cytometry | Using CytoID® Green dye to specifically stain acidic particles in the cells, such as the autophagosomes. |
|
Cellometer image cytometer operation
- Target cell samples are pipetted into a disposable counting chamber
- The chamber is inserted into the Cellometer K2 or Spectrum
- The fluorescence and brightfield images are captured at 4 locations
- Dynamic concentration range is 105 – 107 cells/ml
- Image analysis data is exported into FCS Express™* for fluorescence analysis (*requires a separate license)
- Process of image acquisition and analysis takes less than 1 minute, which can be dependent on the fluorescence exposure time
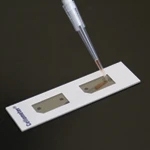
1. Pipette 20 µL of sample into disposable counting chamber
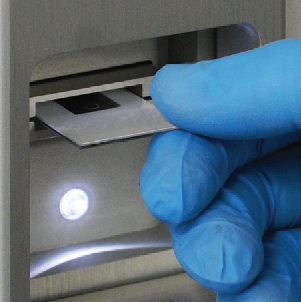
2. Insert counting chamber into Cellometer Vision
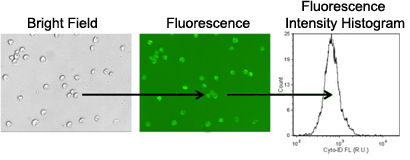
3. Image acquisition and analysis
- Brightfield and fluorescent images are captured for image analysis
- Cells are automatically counted in brightfield
- Fluorescence intensity is measured from each counted cell
- The mean fluorescence intensity is measured from autophagic cell population
Using GFP labeled LC3 protein to determine autophagy activity level
- Standard GFP labeling is expressed on LC3 protein, which is a specific biomarker for autophagosomes
- PA-TU-8988T cells were allowed to culture under rapamycin drug treatment for 24 hours to induce autophagic activity in the cells
- Cellometer Vision image cytometer was used to capture and identify fluorescent positive GFP-LC3 cells
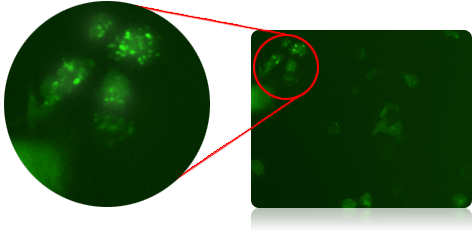
Imaging of GFP-labeled LC3 in PA-TU-8988T cells
Using Cyto-ID green dye to measure autophagy activity level
Cyto-ID green dye staining protocol
- Cyto-ID Green dye (8 µl) is mixed with 4 ml 1X buffer
- Cell sample is centrifuged and resuspended into 200 µl of prepared Cyto-ID Green dye
- Cell sample is incubated for 30 min at 37 °C before image or flow cytometric analysis
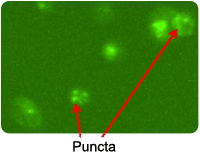
Cyto-ID stained PC3 cells
Puncta are Cyto-ID Green dye-stained autophagosomes that appear when cells become autophagic
Autophagy activity factor
Autophagy Activity Factor (AAF) was used to measure the level of autophagic activity within a cell population

MFI = Mean Fluorescence Intensity
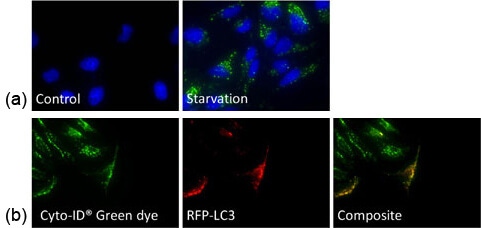
a) HeLa cells were starved and stained with Cyto-ID Green dye, which showed increase in the number of autophagosomes
b) Autophagy-induced HeLa cells were stained with Cyto-ID Green dye and transfected with RFP-LC3 – Co-localization was observed
Comparison of image and flow cytometry
- Jurkat cells were starved in Hank’s Balance Saline Solution (HBSS) for 2 hours, and allowed to recover in media for 1 hour
- Fluorescent signals were compared between Cellometer and FACS Calibur, which showed high and low signals for starved and recovery, respectively
- AAF values were calculated by comparing starved Jurkat cells to the control sample
- Trends in AAF values were comparable between the Cellometer and FACS Calibur
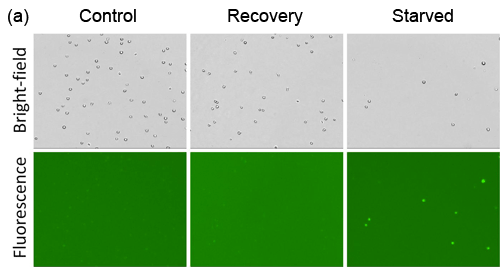
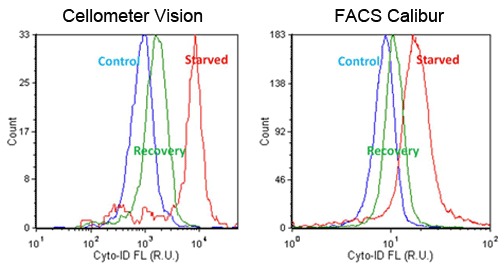
Detection of chemical-induced autophagy activity in jurkat cells
Rapamycin time-dependent dose response
- Jurkat cells were treated with Rapamycin , an autophagy inducing chemicals for 4, 8, and 18 hours
- Various concentrations were tested to study the dose response of Rapamycin (0.01, 0.1, 1, 10, and 100 µM)
- Results showed increasing AAF values for Rapamycin at various concentrations as incubation time increased
- The 18 hour time point showed the highest AAF values compared to 4 and 8 hours.
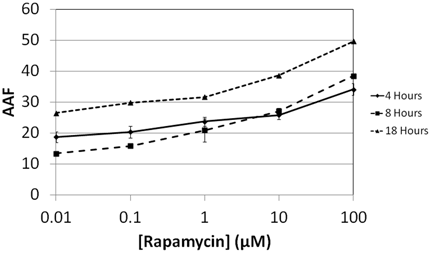
Increase of Autophagy Activity Factor in Jurkat cells is time and drug dependent
Autophagy detection of trypsinized adherent PC3 cells
- Adherent cells were commonly studied in the autophagy research field, thus PC3 prostate cancer cells were used to show the capability of Cellometer image cytometry for detecting autophagic activities in adherent cell lines
- PC3 cells were treated with Rapamycin at various concentrations, as the concentration increased, more puncta were observed in the fluorescent images
- Correspondingly, cell populations with higher mean fluorescence intensity are shown in the table above
- The calculated AAF values also showed increase as the Rapamycin concentration increased
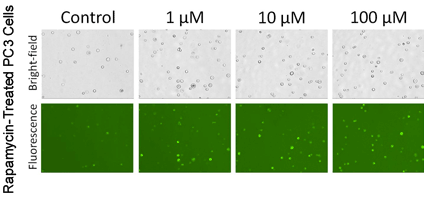
In PC3 cells the highest autophagy activity is seen 100 uM drug treatment
| [Rapamycin] | Control | 1 µM | 10 µM | 100 µM |
|---|---|---|---|---|
| Mean FL intensity (R.U.) | 3543.53 | 4093.25 | 5536.15 | 6042.04 |
| AAF values | 0.00 | 13.43 | 35.99 | 41.35 |
References
- Chan LL, Zhong X, Qiu J, Li PY, Lin B. Cellometer Vision as an Alternative to Flow Cytometry for Cell Cycle Analysis, Mitochondrial Potential, and Immunophenotyping. Cytometry Part A 2011;79A: 507-517.
- Chan LL-Y, Lai N, Wang E, Smith T, Yang X, Lin B. A rapid detection method for apoptosis and necrosis measurement using the Cellometer imaging cytometry. Apoptosis 2011;16: 1295-1303.
For research use only. Not for use in diagnostic procedures.


